Building MBK’s Geyser Monitor: From an ESP32 and a Printed Case to a Remote Dashboard
I wanted a simple answer to a simple question: what is the temperature at my geyser right now?
The first version needed a probe, a readable display, and a way to check the reading from my phone at home. Then I wanted to see it while away. That led to MBK’s Geyser Monitor: an ESP32-based device in a 3D-printed enclosure, with an OLED, a local web interface, and a separate internet dashboard running on Railway.
I kept the scope to my own monitor. There is one owner and one device, with no customer registration or pairing system yet. That made it possible to work through the details that matter in everyday use: first-time Wi-Fi setup, changing networks, recovering from an outage, and making it clear when a displayed temperature is old.
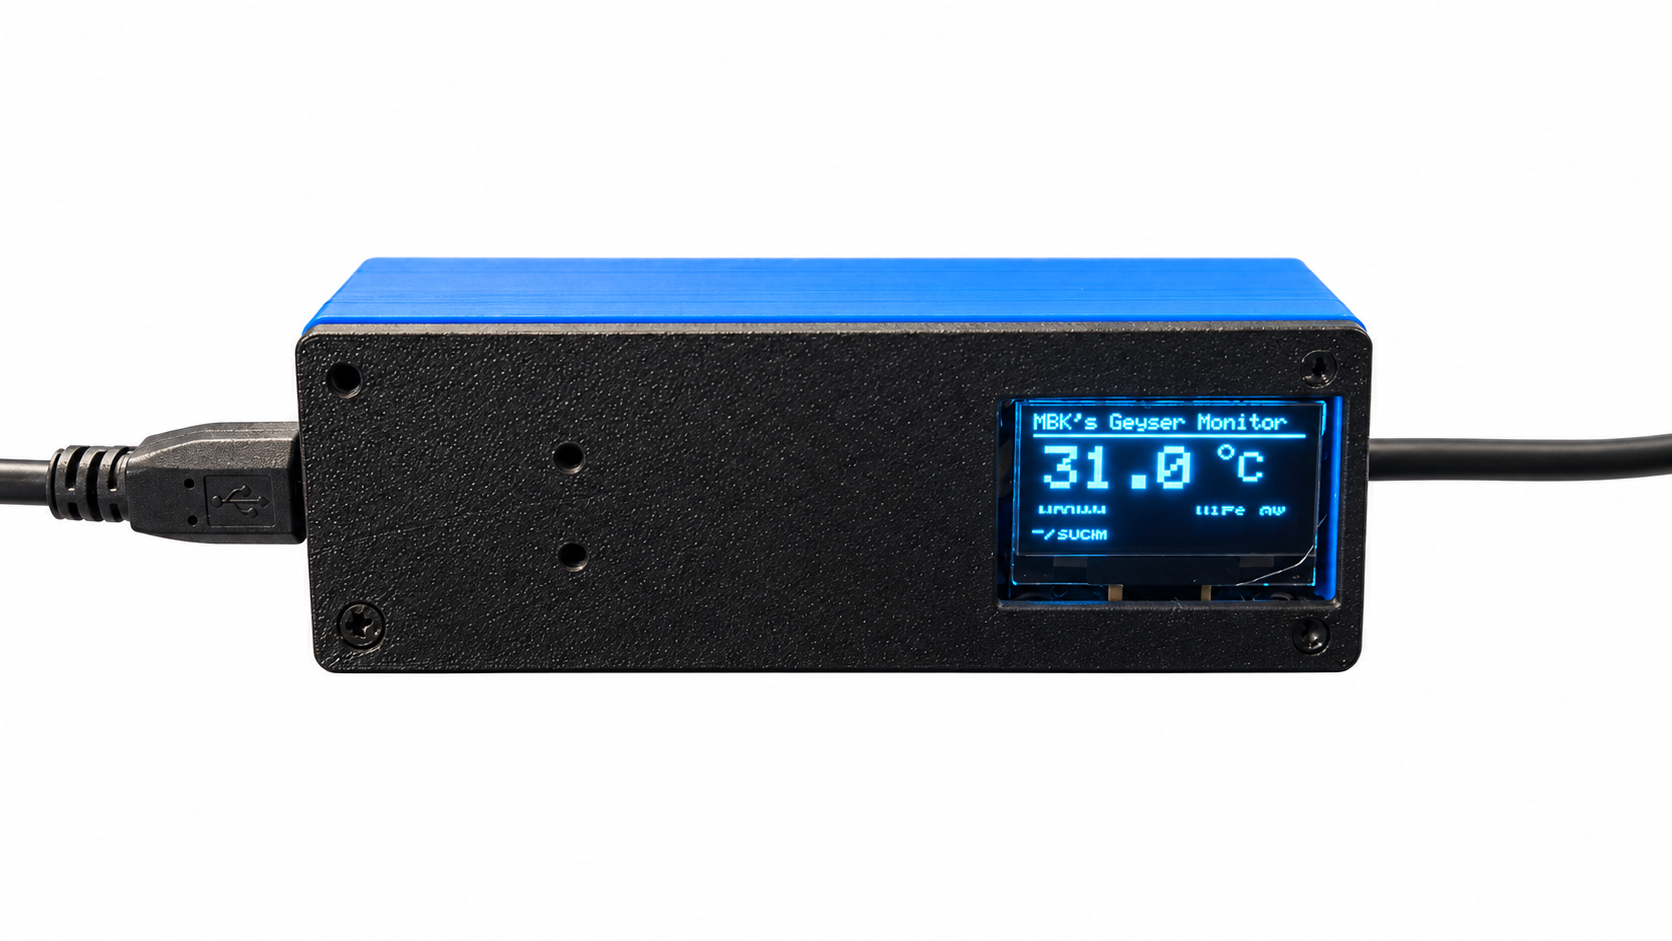
The assembled prototype. Product photographs in this post have cleaned backgrounds; they show the actual device.
The hardware and enclosure
The main components are straightforward:
- ESP32 development board: reads the sensor, drives the display, serves the local pages, and uploads readings.
- DS18B20 temperature probe: a wired digital temperature sensor with a metal-tipped probe assembly.
- 128 × 64 SSD1306 OLED: shows the temperature and connection state without needing a phone.
- USB power: powers the electronics and provides a simple way to restart them.
- 3D-printed base and cover: holds the board and display together while leaving the screen and cable connections accessible.
The DS18B20 uses a 1-Wire interface and supports 9- to 12-bit resolution. Its chip specification gives ±0.5°C accuracy from −10°C to +85°C. That is a component specification, not a calibration result for my finished monitor: probe construction, placement and thermal contact all affect the reading in an installation.
For this ESP32 board, the sensor data line is on GPIO 4. The OLED uses GPIO 21 for SDA and GPIO 22 for SCL, with I²C address 0x3C. Both peripherals share ground with the ESP32. For a three-wire, externally powered DS18B20 connection, use 3.3V for VDD and a pull-up from the data line to 3.3V; 4.7 kΩ is the usual starting point, as described in Analog Devices’ pull-up guidance. Check whether a sensor module already includes that resistor, and confirm the pinout of the particular probe rather than trusting cable colours.
The OLED connects to 3.3V and ground as well as its two I²C signals. These pin assignments describe this prototype; a different ESP32 board or display may need changes.
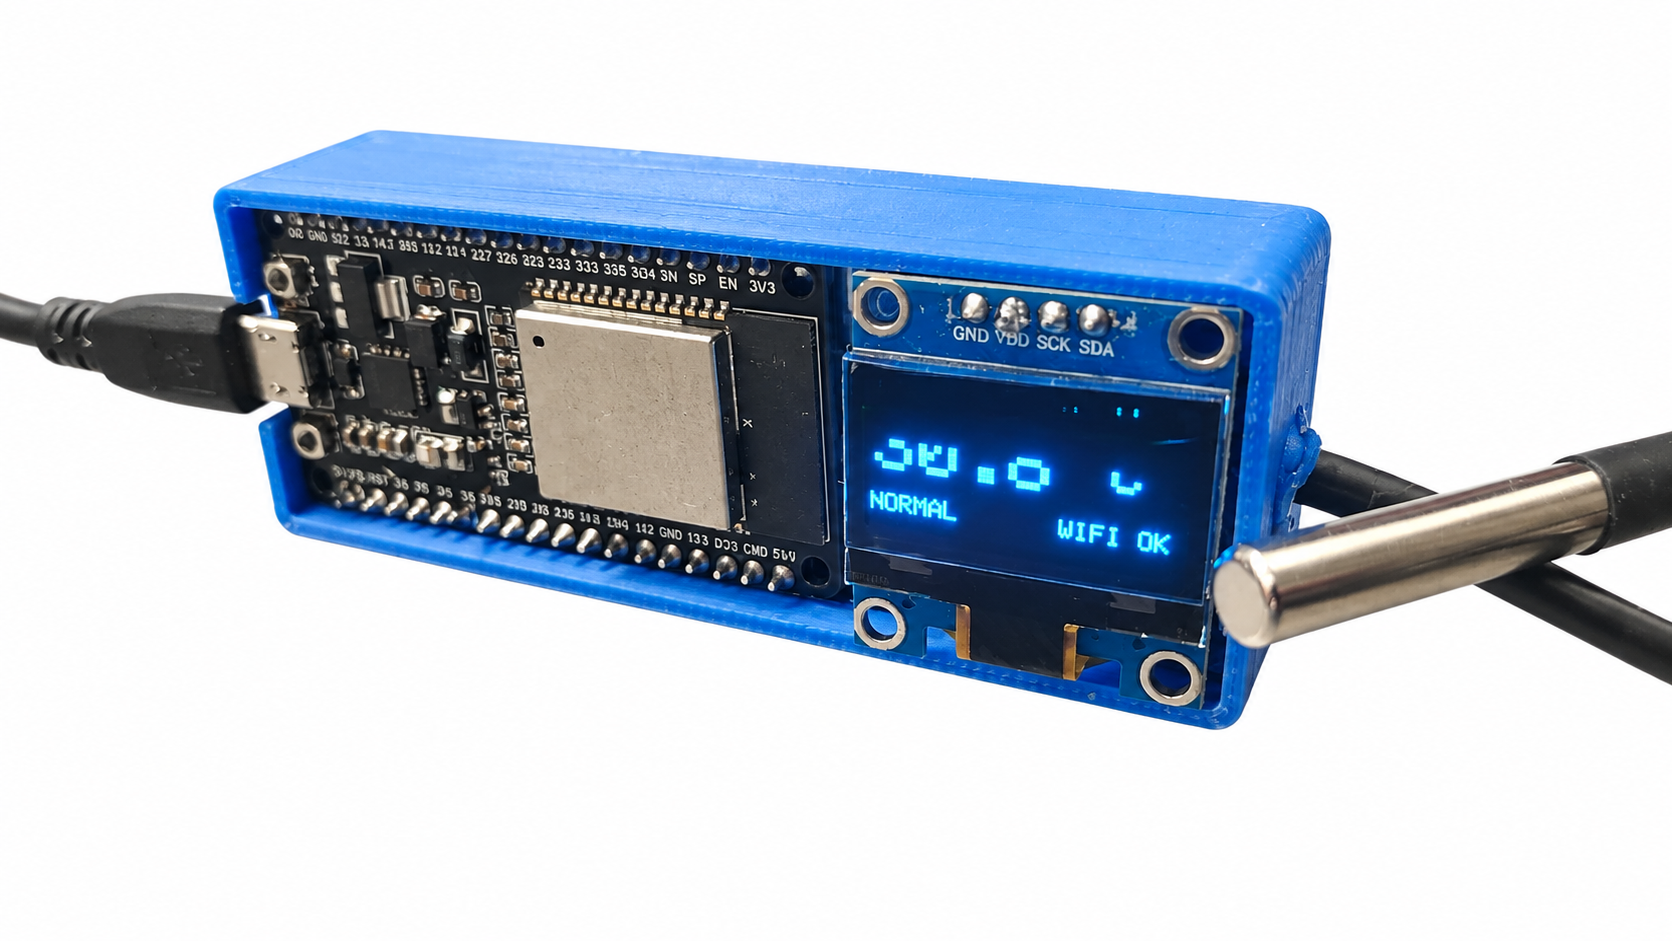
Removing the cover makes the layout easier to see. Normal operation does not require opening the case.
The enclosure helped turn loose electronics into something I could hand to another person. It also exposed a documentation mistake worth catching: this prototype has no externally accessible setup/reset button. A manual that says “hold the reset button for five seconds” is useless if that button does not exist.
This is a temperature-monitoring prototype. It does not switch the geyser, replace its thermostat, or establish that water is safe to touch. The printed enclosure is not being presented as a waterproof or heat-rated housing; keep the electronics away from water and hot surfaces. The wiring described here is for the low-voltage monitor, not the geyser’s mains supply.
Keep local monitoring independent of the cloud
There are three ways to see a reading:
- On the OLED, directly at the device.
- On the local web page, from a phone on the same home network.
- On the internet dashboard, from a phone or computer with internet access.
The ESP32 sends data outward to Railway over HTTPS. My phone talks to that hosted application. I did not need to open an inbound port on the home router or expose the ESP32’s local web server to the internet.
The data path is:
DS18B20 probe → ESP32 → OLED
                  ├── local web dashboard on home Wi-Fi
                  └── HTTPS upload → Railway app → PostgreSQL
                                          ↑
                              browser / installed web app
An internet failure should interrupt remote updates without stopping local temperature readings. That requirement shaped the firmware: sensor conversion is asynchronous, the setup portal runs without blocking the main loop, and cloud requests run in a separate FreeRTOS task.
Reading the sensor without freezing the interface
The Arduino sketch uses OneWire, DallasTemperature, WiFiManager, Adafruit GFX, and Adafruit SSD1306, alongside the networking libraries in the ESP32 Arduino core. The DallasTemperature library handles the sensor interface, while Adafruit’s SSD1306 library handles the display.
Here is a shortened initialization excerpt. The objects are created elsewhere in the sketch:
Wire.begin(21, 22);
oledAvailable = display.begin(SSD1306_SWITCHCAPVCC, 0x3C);

sensors.begin();
sensors.setResolution(12);
sensors.setWaitForConversion(false);
The important choice is setWaitForConversion(false). Instead of waiting inside the conversion request, the loop starts a measurement and comes back for the result. At 12-bit resolution, the code allows 750 milliseconds before reading it, consistent with the DS18B20’s maximum conversion time in its datasheet.
This is the relevant loop logic, reformatted from the firmware. It depends on the sketch’s existing state variables and publishCloud() helper; it is not a complete replacement sketch:
unsigned long t = millis();

if (!converting && t - lastCycle >= 2000) {
  lastCycle = t;
  requestedAt = t;
  sensors.requestTemperatures();
  converting = true;
}

if (converting && t - requestedAt >= 750) {
  converting = false;
  float reading = sensors.getTempCByIndex(0);
  sensorConnected = reading != DEVICE_DISCONNECTED_C
                 && reading >= -55 && reading <= 125;

  if (sensorConnected) {
    temperatureC = reading;
    minTemperature = min(minTemperature, reading);
    maxTemperature = max(maxTemperature, reading);
  }
  publishCloud(temperatureC, sensorConnected);
}
Local readings run on roughly a two-second cycle. The OLED refreshes every second, and the local web page requests updates every two seconds. A missing sensor becomes a sensor error, rather than a plausible-looking temperature.
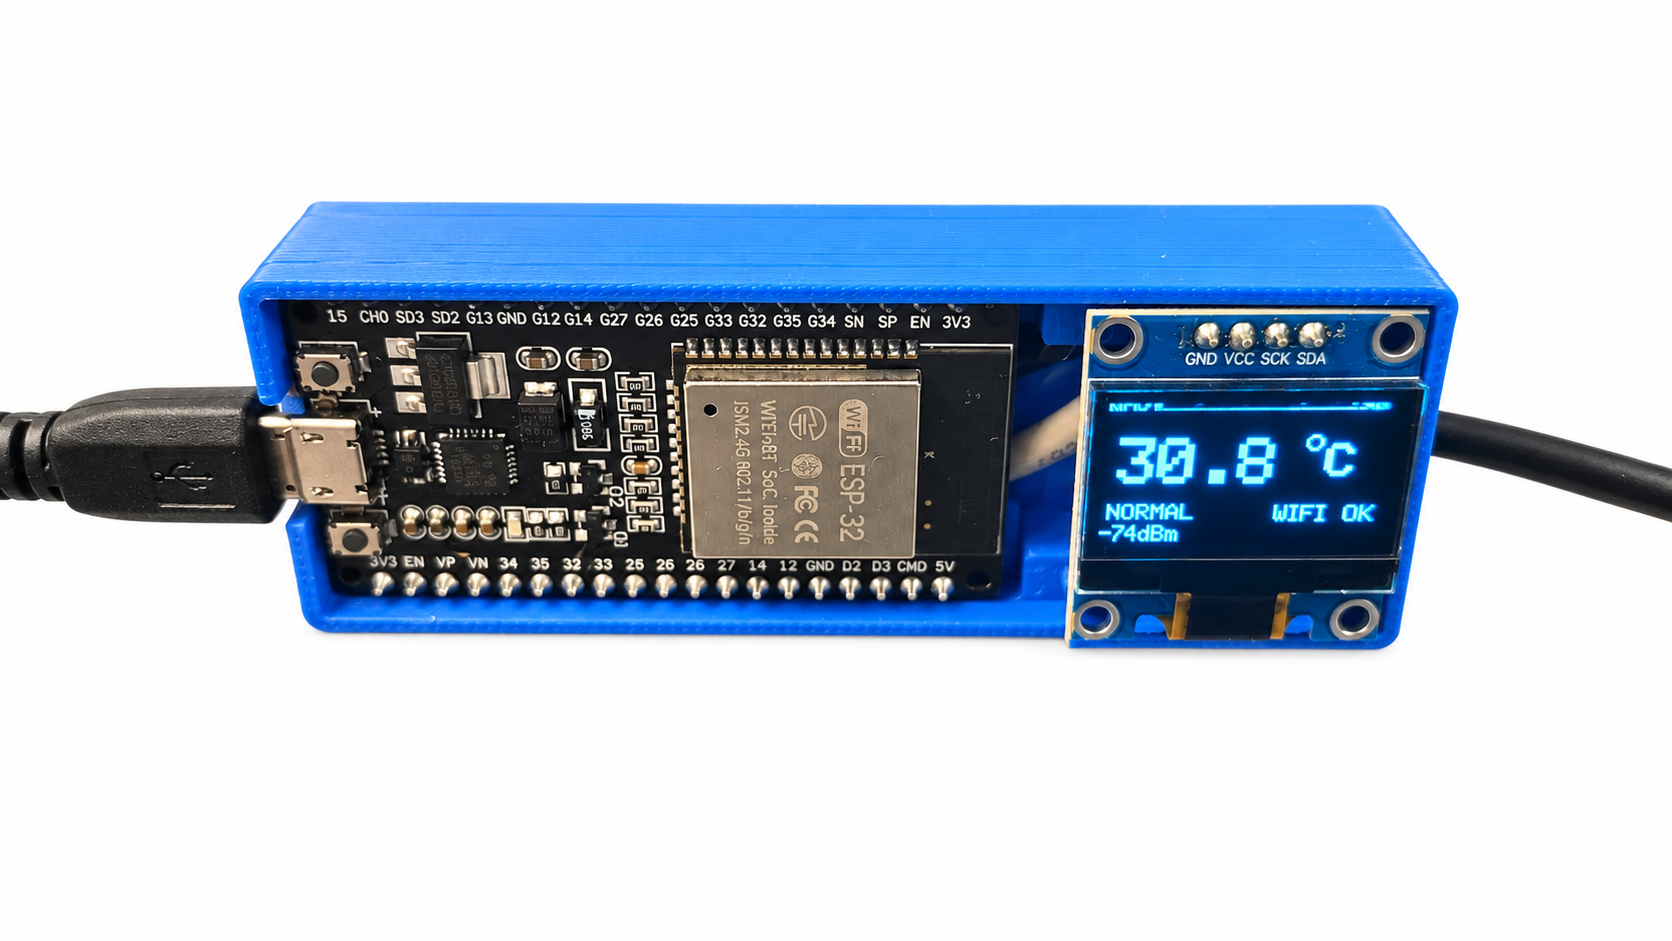
The OLED remains useful even when remote access is unavailable.
The status thresholds are shared between firmware and cloud: Normal below 65°C, High from 65°C to below 75°C, and Critical at 75°C and above. These are the prototype’s display thresholds, not recommended bathing temperatures or a substitute for independent temperature protection.
First-time Wi-Fi setup: why 192.168.4.1 is correct
I wanted the user to enter their home Wi-Fi credentials through a setup page rather than recompile firmware whenever the network changed.
WiFiManager provides the temporary access point and captive portal. In this build, the setup network is named GeyserMonitor-XXXX, where the suffix identifies the device. Its prototype setup password is setup1234. That is only the temporary Wi-Fi password; it is separate from both the owner’s cloud login and the device upload key. A customer version should use a unique provisioning password per device.
The user connects their phone to that network, opens the portal, chooses Configure WiFi, and saves their home network’s credentials. If the portal does not appear automatically, the fallback address is http://192.168.4.1. WiFiManager documents this as its default portal address.
That address is unrelated to whether the home router uses 192.168.1.1, 192.168.0.1, or something else. During setup, the ESP32 is creating the network the phone has joined. After configuration, it joins the home network and gets a different address from the router. Espressif’s Wi-Fi documentation explains this distinction between access-point and station modes.
After connection, the firmware starts mDNS so the local dashboard can be reached at http://geyser.local:
// Run after the ESP32 connects to the home Wi-Fi.
MDNS.end();
MDNS.begin("geyser");
MDNS.addService("http", "tcp", 80);
Espressif’s mDNS example describes advertising a hostname with the .local suffix. The phone must be on a network that can discover the device; guest-network isolation and multicast restrictions can interfere. The assigned local IP remains a useful fallback.
In the current firmware, geyser.local is started after home Wi-Fi connects. It is not the first-time setup address. The manual now separates those two stages explicitly.
Restarting is different from forgetting Wi-Fi
The local Settings page, at http://geyser.local/settings, has three distinct controls:
- Restart Device: reboot while keeping saved Wi-Fi credentials.
- Change Wi-Fi: open the setup portal without first erasing the saved network.
- Reset Wi-Fi Settings: clear the saved network after confirmation and restart into setup.
Unplugging and reconnecting USB power also restarts the device while keeping its Wi-Fi settings. Local minimum and maximum readings start again after a restart; uploaded cloud history stays in the database.
There was a practical implementation detail here: the local web server and WiFiManager’s portal both want port 80. When opening the portal, the firmware stops the local server. Once the portal is no longer active, it starts the local server again. The controls use POST requests with a per-boot form token, and the action is delayed briefly so the browser can receive its response before the device restarts or changes network mode.
Those controls are local. The cloud dashboard can rename the monitor, but it does not remotely reset the device or change its Wi-Fi. The local interface assumes a trusted home network; its form token is not a separate owner-login system.
Sending readings securely to Railway
For the remote version I built a small Node.js/Express application, with PostgreSQL in production. The dashboard is a web app that can be added to a phone’s home screen, so I did not need to maintain separate native Android and iOS apps for the first version.
The ESP32 uploads to POST /api/v1/readings. A representative body looks like this:
{
  "device_id": "geyser-home",
  "boot_id": "example-boot-0001",
  "seq": 42,
  "temperature": 48.5,
  "sensor_ok": true,
  "rssi": -58
}
The device ID identifies the monitor; it is not a password. Each boot has a new identifier, and each measurement has a sequence number. Together they let the server recognize duplicate uploads. For a failed sensor reading, the uploader sends sensor_ok: false and temperature: null.
The request carries a separate secret device key in the Authorization header. Here is an abbreviated transport excerpt; body, the constants, and error handling belong to the surrounding uploader:
WiFiClientSecure client;
client.setCACert(MBK_ROOT_CA);
client.setHandshakeTimeout(5);

HTTPClient http;
http.setConnectTimeout(4000);
http.setTimeout(4000);

if (http.begin(client, MBK_CLOUD_URL)) {
  http.addHeader("Content-Type", "application/json");
  http.addHeader("Authorization", String("Bearer ") + MBK_DEVICE_KEY);
  int result = http.POST(body);
  // The surrounding task handles failures and later attempts.
  http.end();
}
The configured build validates the server certificate with a CA certificate and synchronizes its clock before uploading. It does not disable TLS verification. The actual key lives in a private CloudConfig.h, excluded from Git. The browser never receives that key, and the owner’s login uses a separate password hash and server-side sessions.
Cloud requests can be slow, so they run in a separate task. A one-element queue holds the latest measurement: when a new reading arrives, it replaces the older queued reading. The main loop can continue updating the OLED while a network request is in progress.
The server checks the key and payload before storing a reading. It rejects malformed data and deduplicates the combination of device, boot and sequence. This excerpt shows the insert used by the application, inside its transaction:
INSERT INTO readings
  (device_id, boot_id, seq, received_at, temperature, sensor_ok, rssi)
VALUES ($1, $2, $3, $4, $5, $6, $7)
ON CONFLICT (device_id, boot_id, seq) DO NOTHING
RETURNING seq;
The server records receipt time. This first version does not keep an offline backlog, so an internet outage creates missing history rather than a burst of old readings when the connection returns. That is a deliberate limitation, and one I would revisit for a logging product.
The remote dashboard
The hosted application is at mbkgeysermonitor.up.railway.app. The owner’s readings require sign-in. The Explore with example readings option provides a clearly labelled preview without exposing private measurements.
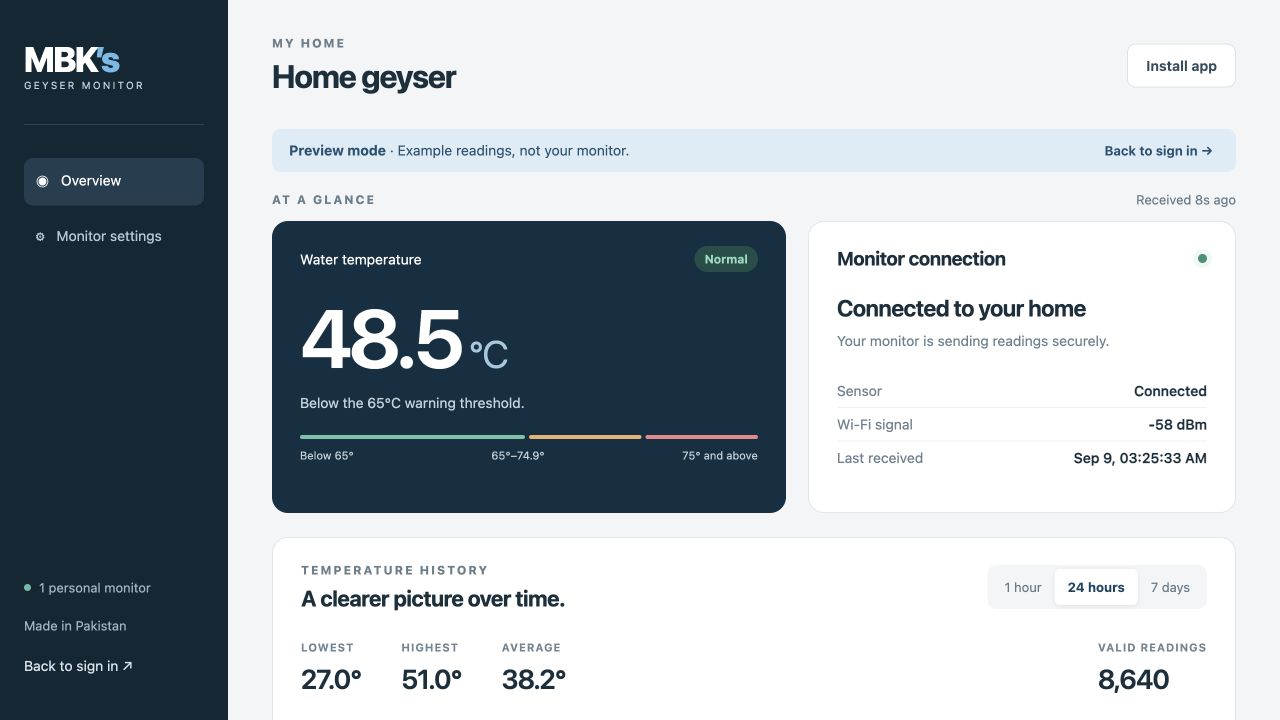
Actual application, example data. These numbers are a UI demonstration, not measurements from my geyser.
The dashboard shows the latest temperature, sensor and connection status, and when a reading was last received. History can be viewed over one hour, 24 hours or seven days, with lowest, highest and average values for that selected period. It also records recent activity and can export the last seven days as CSV. Readings and events have a 90-day retention window in this version.
That distinction between local min/max since restart and cloud statistics for a selected period matters. Both can be correct while displaying different numbers.
The device uploads roughly every ten seconds, and the browser checks for updates every ten seconds. Those waits can add together, so a change may take around 20 seconds, plus network time, to appear remotely. The uploader waits after a request finishes, so this is an approximate cadence rather than a strict ten-second schedule.
A five-second cadence is a possible next improvement, but it has not been applied to this version. Faster updates would also mean more requests and stored readings. For now, the dashboard exposes freshness instead of implying that a remote number is instantaneous.
If no new reading arrives for about 60 seconds, the dashboard treats the monitor as offline. If the browser cannot reach the server, it shows a separate warning that displayed data may be out of date. The OLED continues locally while Wi-Fi reconnects. Browser alerts are available while the app is open; there are no background push, email or SMS notifications yet.
Deploying from GitHub
I already had a paid Railway account, so I used a separate project with an application service and PostgreSQL. The application source is in a private GitHub repository. Railway follows its main branch and builds the application when changes are pushed, using the project’s Dockerfile and deployment configuration. Railway documents this in its GitHub autodeploy guide.
The main production configuration is:
NODE_ENV=production
PUBLIC_URL=https://your-app.up.railway.app
DATABASE_URL=<Railway PostgreSQL connection string>
DEVICE_ID=geyser-home
DEVICE_API_KEY=<a unique random device secret>
OWNER_PASSWORD_HASH=<generated salted scrypt hash>
These are placeholders, not runnable credentials. The real values are deployment variables. PUBLIC_URL must match the actual browser origin, and the firmware’s endpoint must match the HTTPS domain plus /api/v1/readings. When I renamed the Railway domain, both sides needed to agree on the new address.
The service checks database connectivity through /health and uses one application replica for this personal version. I would add tested backups, restore procedures and operational monitoring before treating it as a customer service.
The complete application repository remains private; the snippets above show the relevant implementation patterns without publishing configured firmware or private access files. They are excerpts, not a complete flashable sketch or a complete backend.
What I checked, and what comes next
The cloud-enabled firmware compiled for the ESP32 Arduino core used by this build. Application tests covered login and sessions, device authentication, invalid payloads, duplicate readings, threshold changes, offline recovery, history statistics and CSV export. The database tests also exercised the SQL through a PostgreSQL engine using PGlite. Deployment checks covered the hosted app’s health and authentication.
Those checks are useful, but they do not establish sensor calibration, enclosure durability, or long-term field reliability. Those need physical testing over time.
Before extending this to other customers, I would add device claiming, separate owner accounts, individual revocable upload keys, password recovery, and a clearer provisioning process. I would also evaluate offline storage, background notifications, and a recovery path for changing Wi-Fi when the old network is no longer available.
The most useful lesson from this build was how much work sits around the temperature reading. A working sensor is the beginning. The product becomes usable when someone can connect it, understand what the screen is telling them, recover from a network problem, and distinguish a fresh reading from an old one.
That is where this first version stands: a personal monitor, a printed case, and a remote dashboard built around everyday use. Made in Pakistan.
References
- Analog Devices: DS18B20 product page and datasheet — sensor interface, resolution, accuracy and conversion timing.
- Analog Devices: DS18B20 pull-up resistor guidance — the data-line pull-up.
- Espressif: Arduino ESP32 Wi-Fi API — access-point and station operation.
- WiFiManager source and documentation — captive-portal provisioning and the default setup IP.
- DallasTemperature library — Arduino sensor support.
- Adafruit SSD1306 library — OLED display support.
- Espressif mDNS advertise example — local hostname discovery.
- Railway: GitHub autodeploys — deployment from a connected repository branch.